Auto-exposures enterprise
As a data team, it’s critical that you have context into the downstream use cases and users of your data products. Auto-exposures integrate natively with Tableau (Power BI coming soon) and auto-generate downstream lineage in dbt Explorer for a richer experience.
Auto-exposures help users understand how their models are used in downstream analytics tools to inform investments and reduce incidents — ultimately building trust and confidence in data products. It imports and auto-generates exposures based on Tableau dashboards, with user-defined curation.
Supported plans
Auto-exposures is available on the dbt Cloud Enterprise plan. Currently, you can only connect to a single Tableau site on the same server.
If you're using Tableau Server, you need to allowlist dbt Cloud's IP addresses for your dbt Cloud region.
For more information on how to set up auto-exposures, prerequisites, and more — refer to configure auto-exposures in Tableau and dbt Cloud.
View auto-exposures
After setting up auto-exposures in dbt Cloud, you can view them in dbt Explorer for a richer experience.
Navigate to dbt Explorer by clicking on the Explore link in the navigation. From the Overview page, you can view auto-exposures from a couple of places:
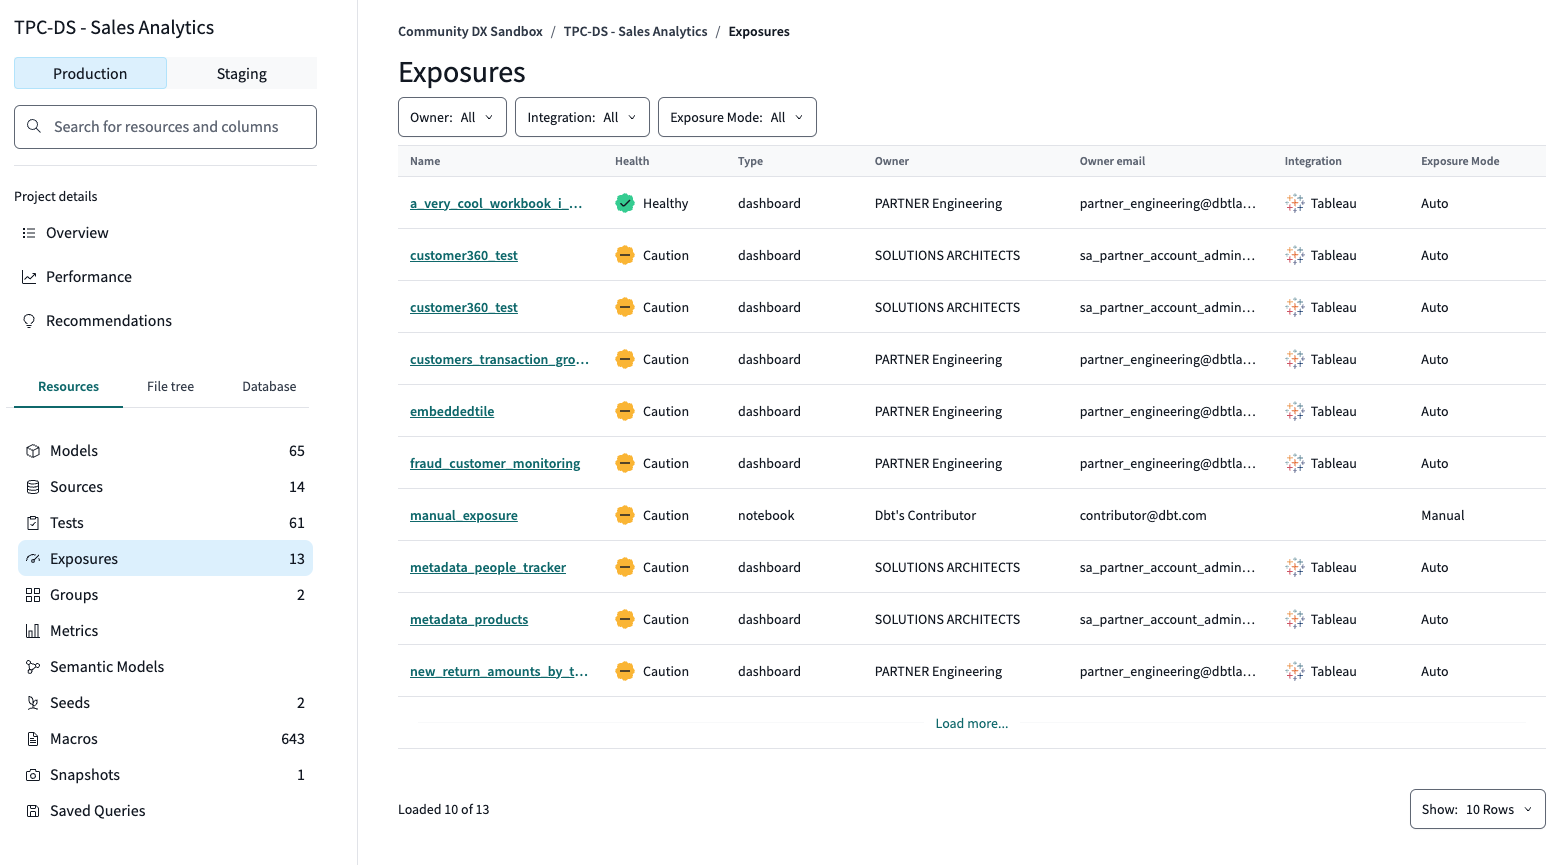
Exposures menu
View auto exposures from the Exposures menu item under Resources. This menu provides a comprehensive list of all the exposures so you can quickly access and manage them. The menu displays the following information:
- Name: The name of the exposure.
- Health: The data health signal of the exposure.
- Type: The type of exposure, such as
dashboardornotebook. - Owner: The owner of the exposure.
- Owner email: The email address of the owner of the exposure.
- Integration: The BI tool that the exposure is integrated with.
- Exposure mode: The type of exposure defined: Auto or Manual. Exposures in dbt can be configured in two ways:
- Manual — Defined manually and explicitly in your project’s YAML files.
- Auto — Pulled automatically from your BI tool as long as your BI tool integrates with dbt Cloud and you have access to auto-exposures.
- dbt Cloud automatically creates auto exposures for users with access, removing the need for manual YAML definitions. These auto exposures are stored in dbt’s metadata system, appear in dbt Explorer, and behave like manual exposures, however they don’t exist in YAML files.
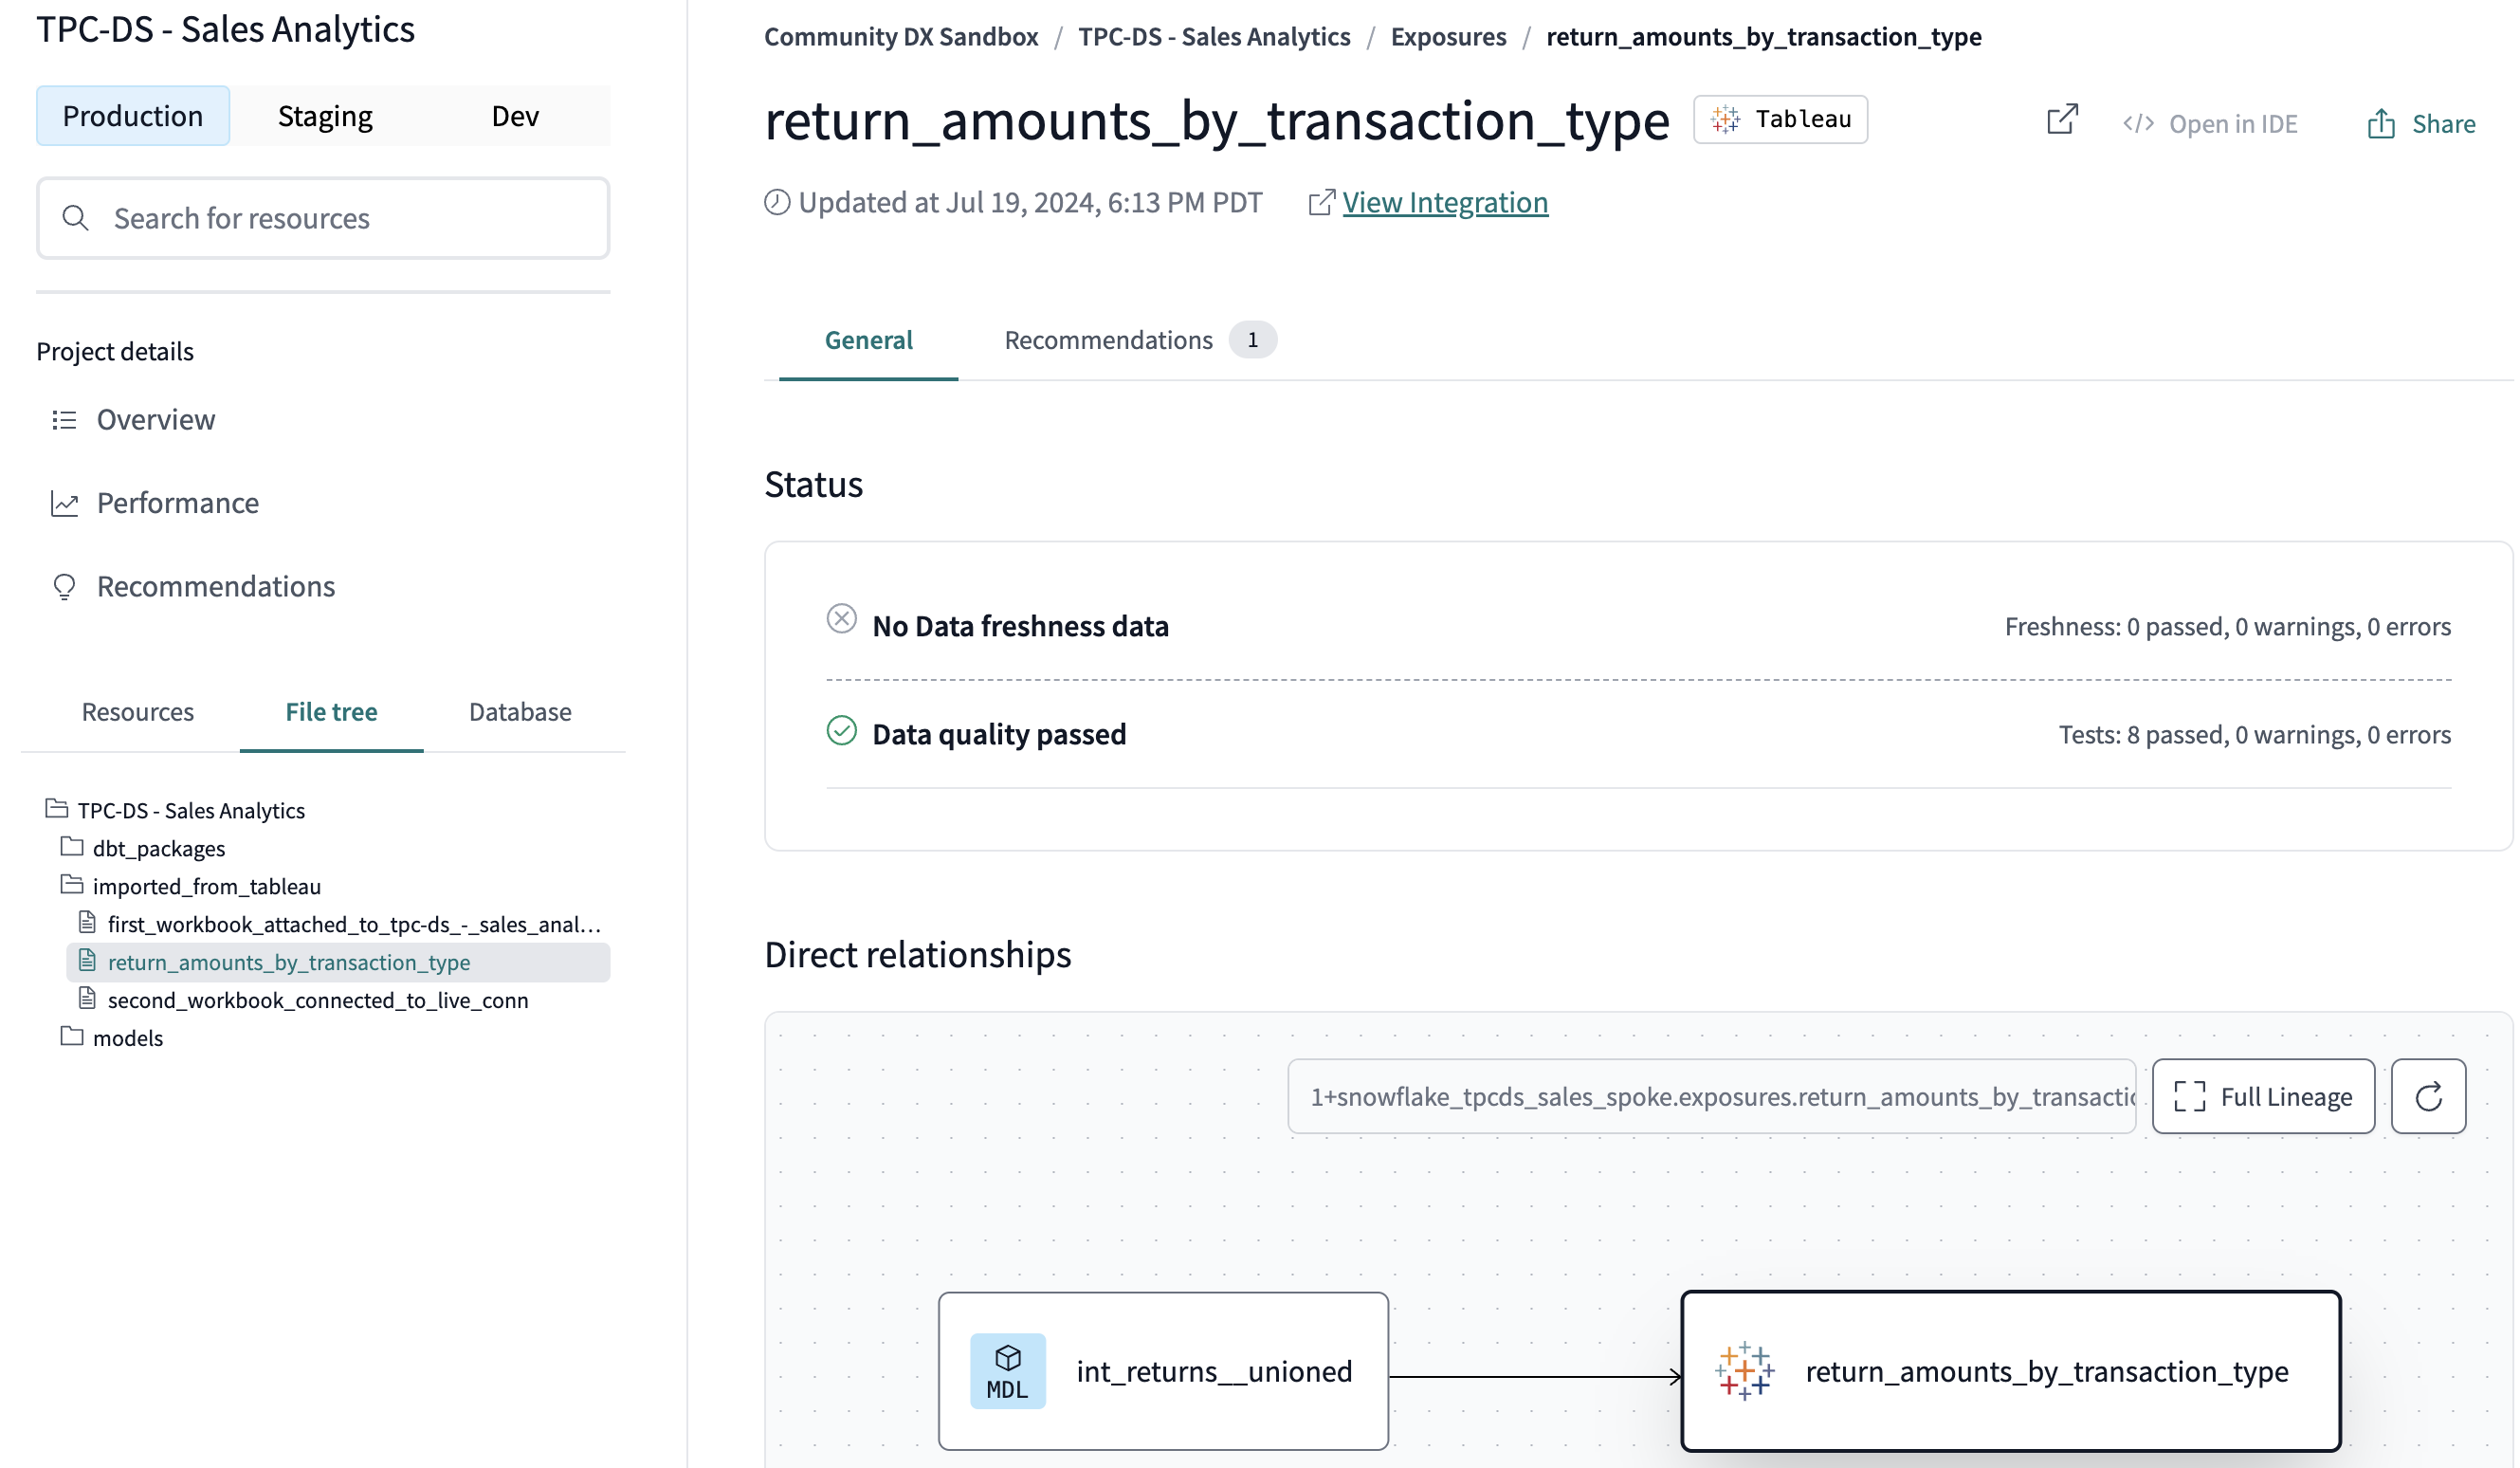
File tree
Locate directly from within the File tree under the imported_from_tableau sub-folder. This view integrates exposures seamlessly with your project files, making it easy to find and reference them from your project's structure.
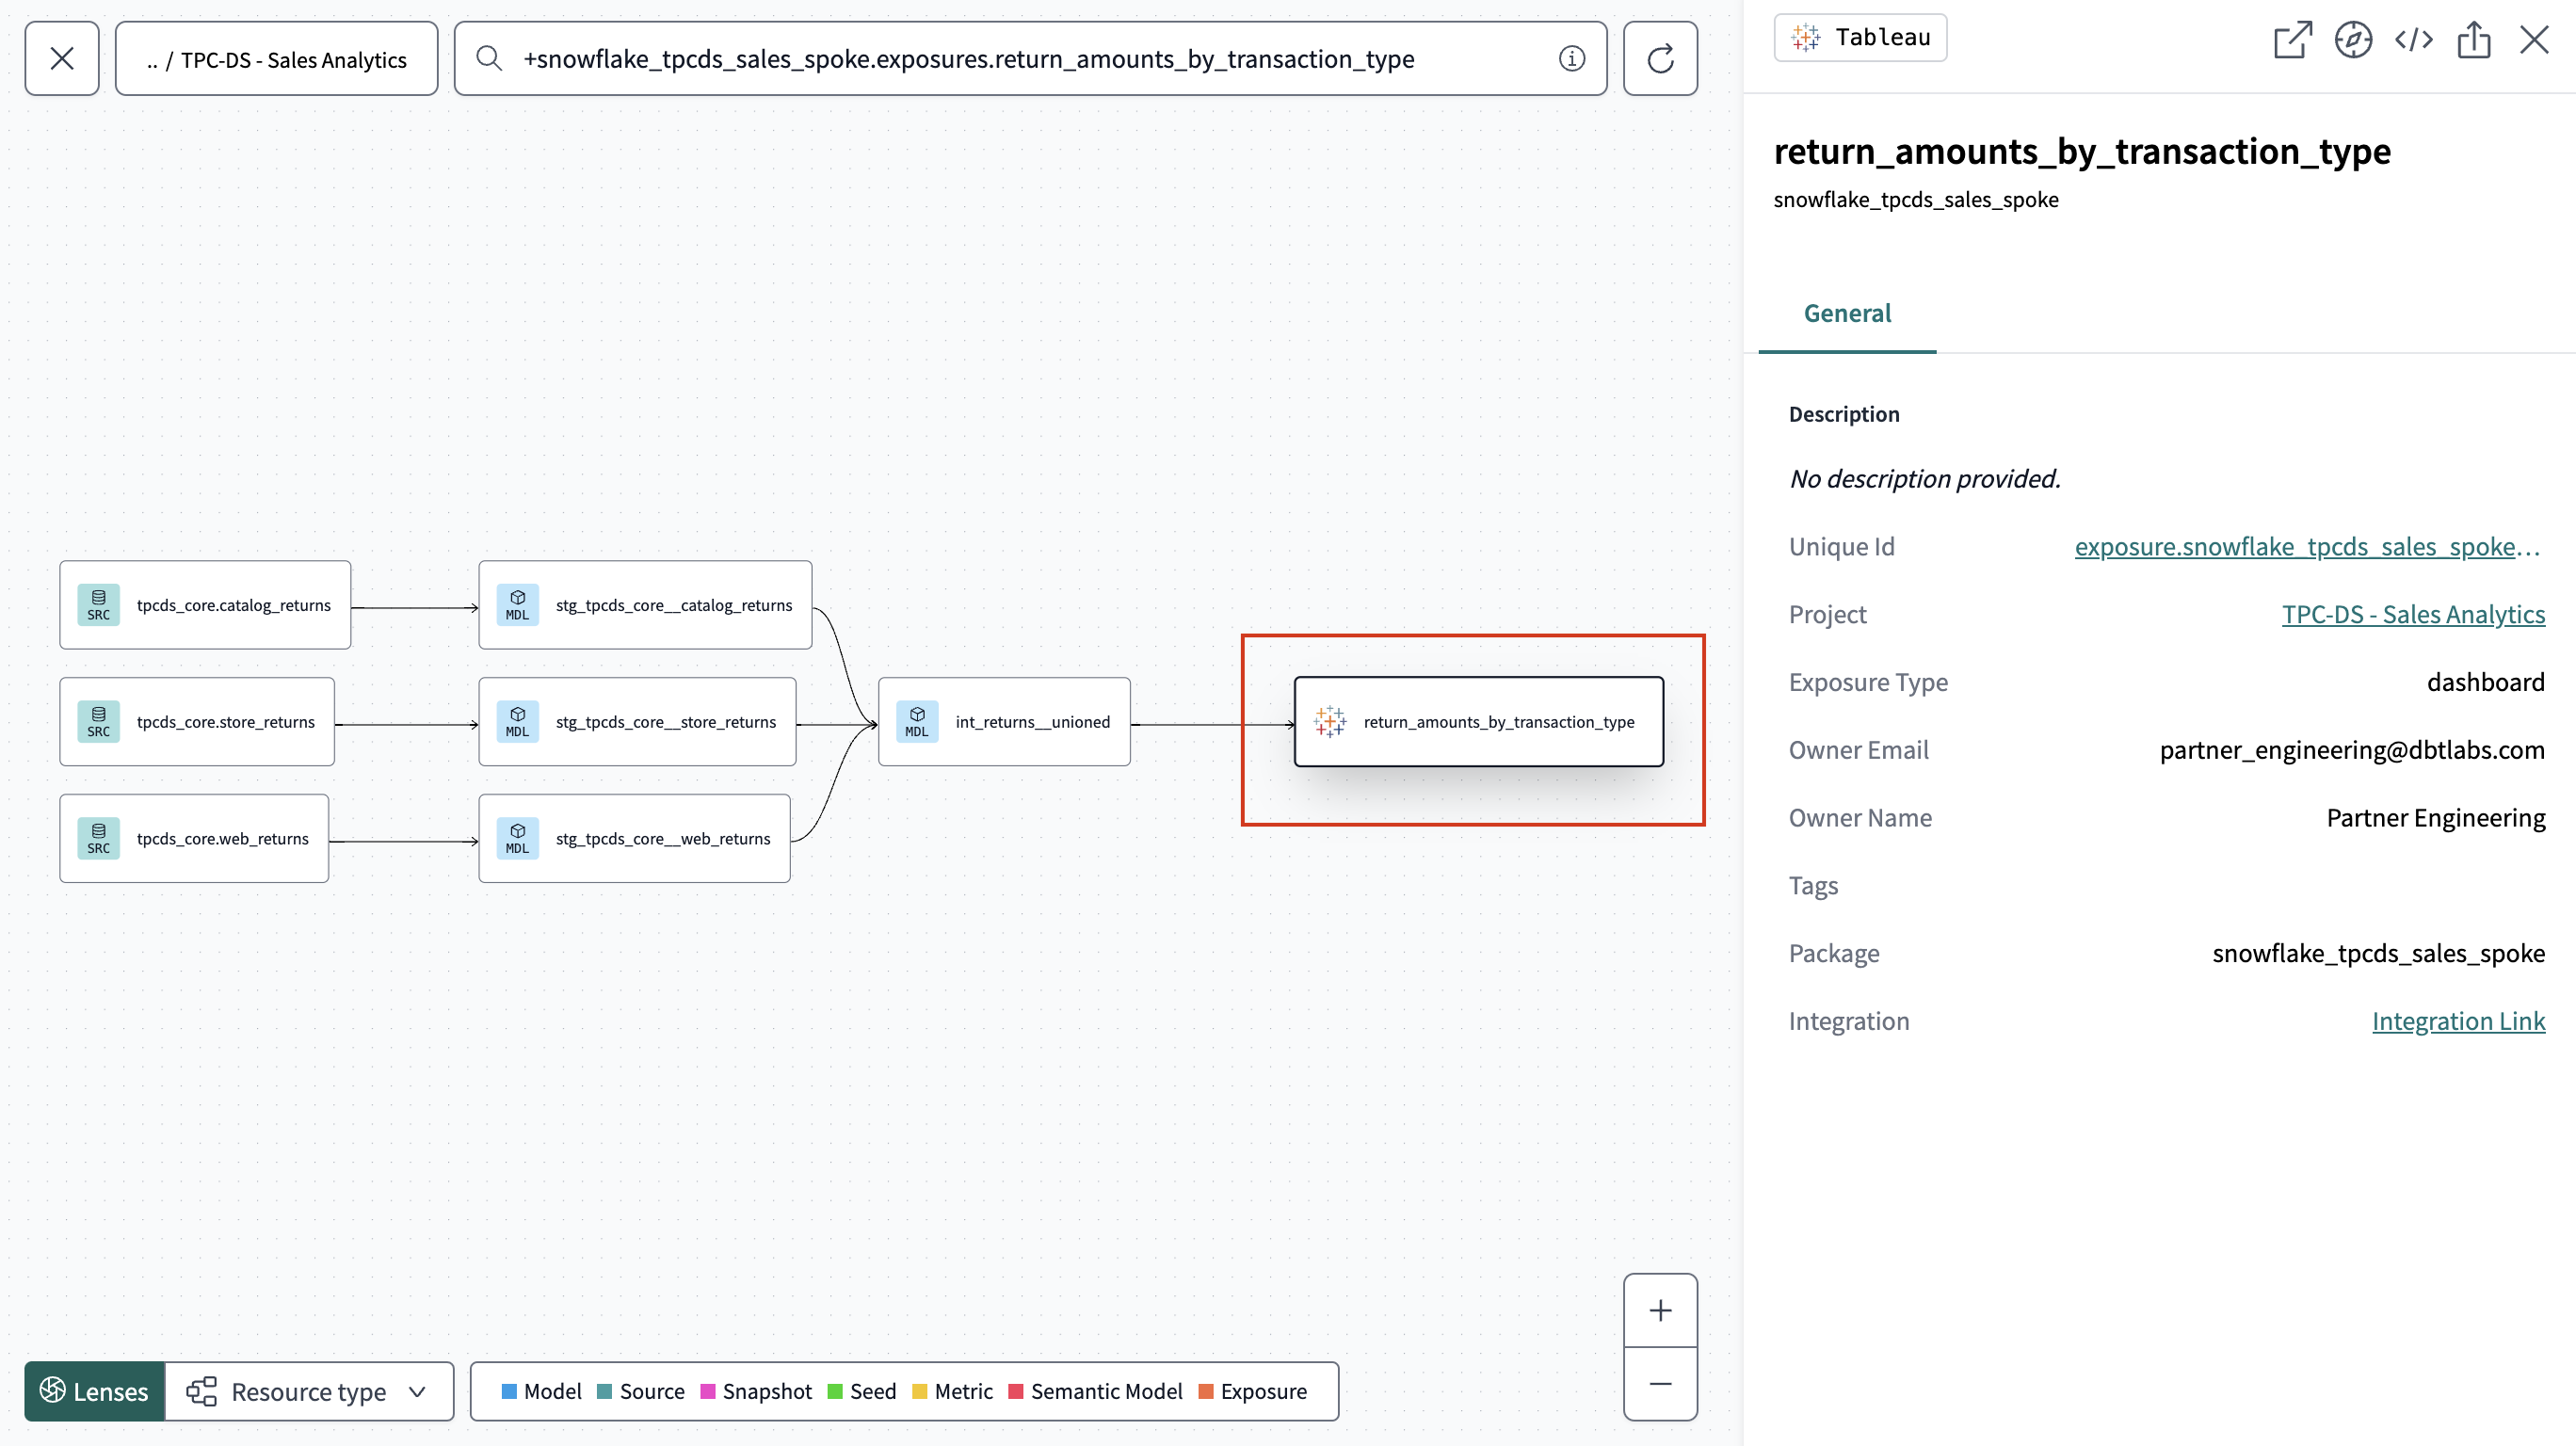
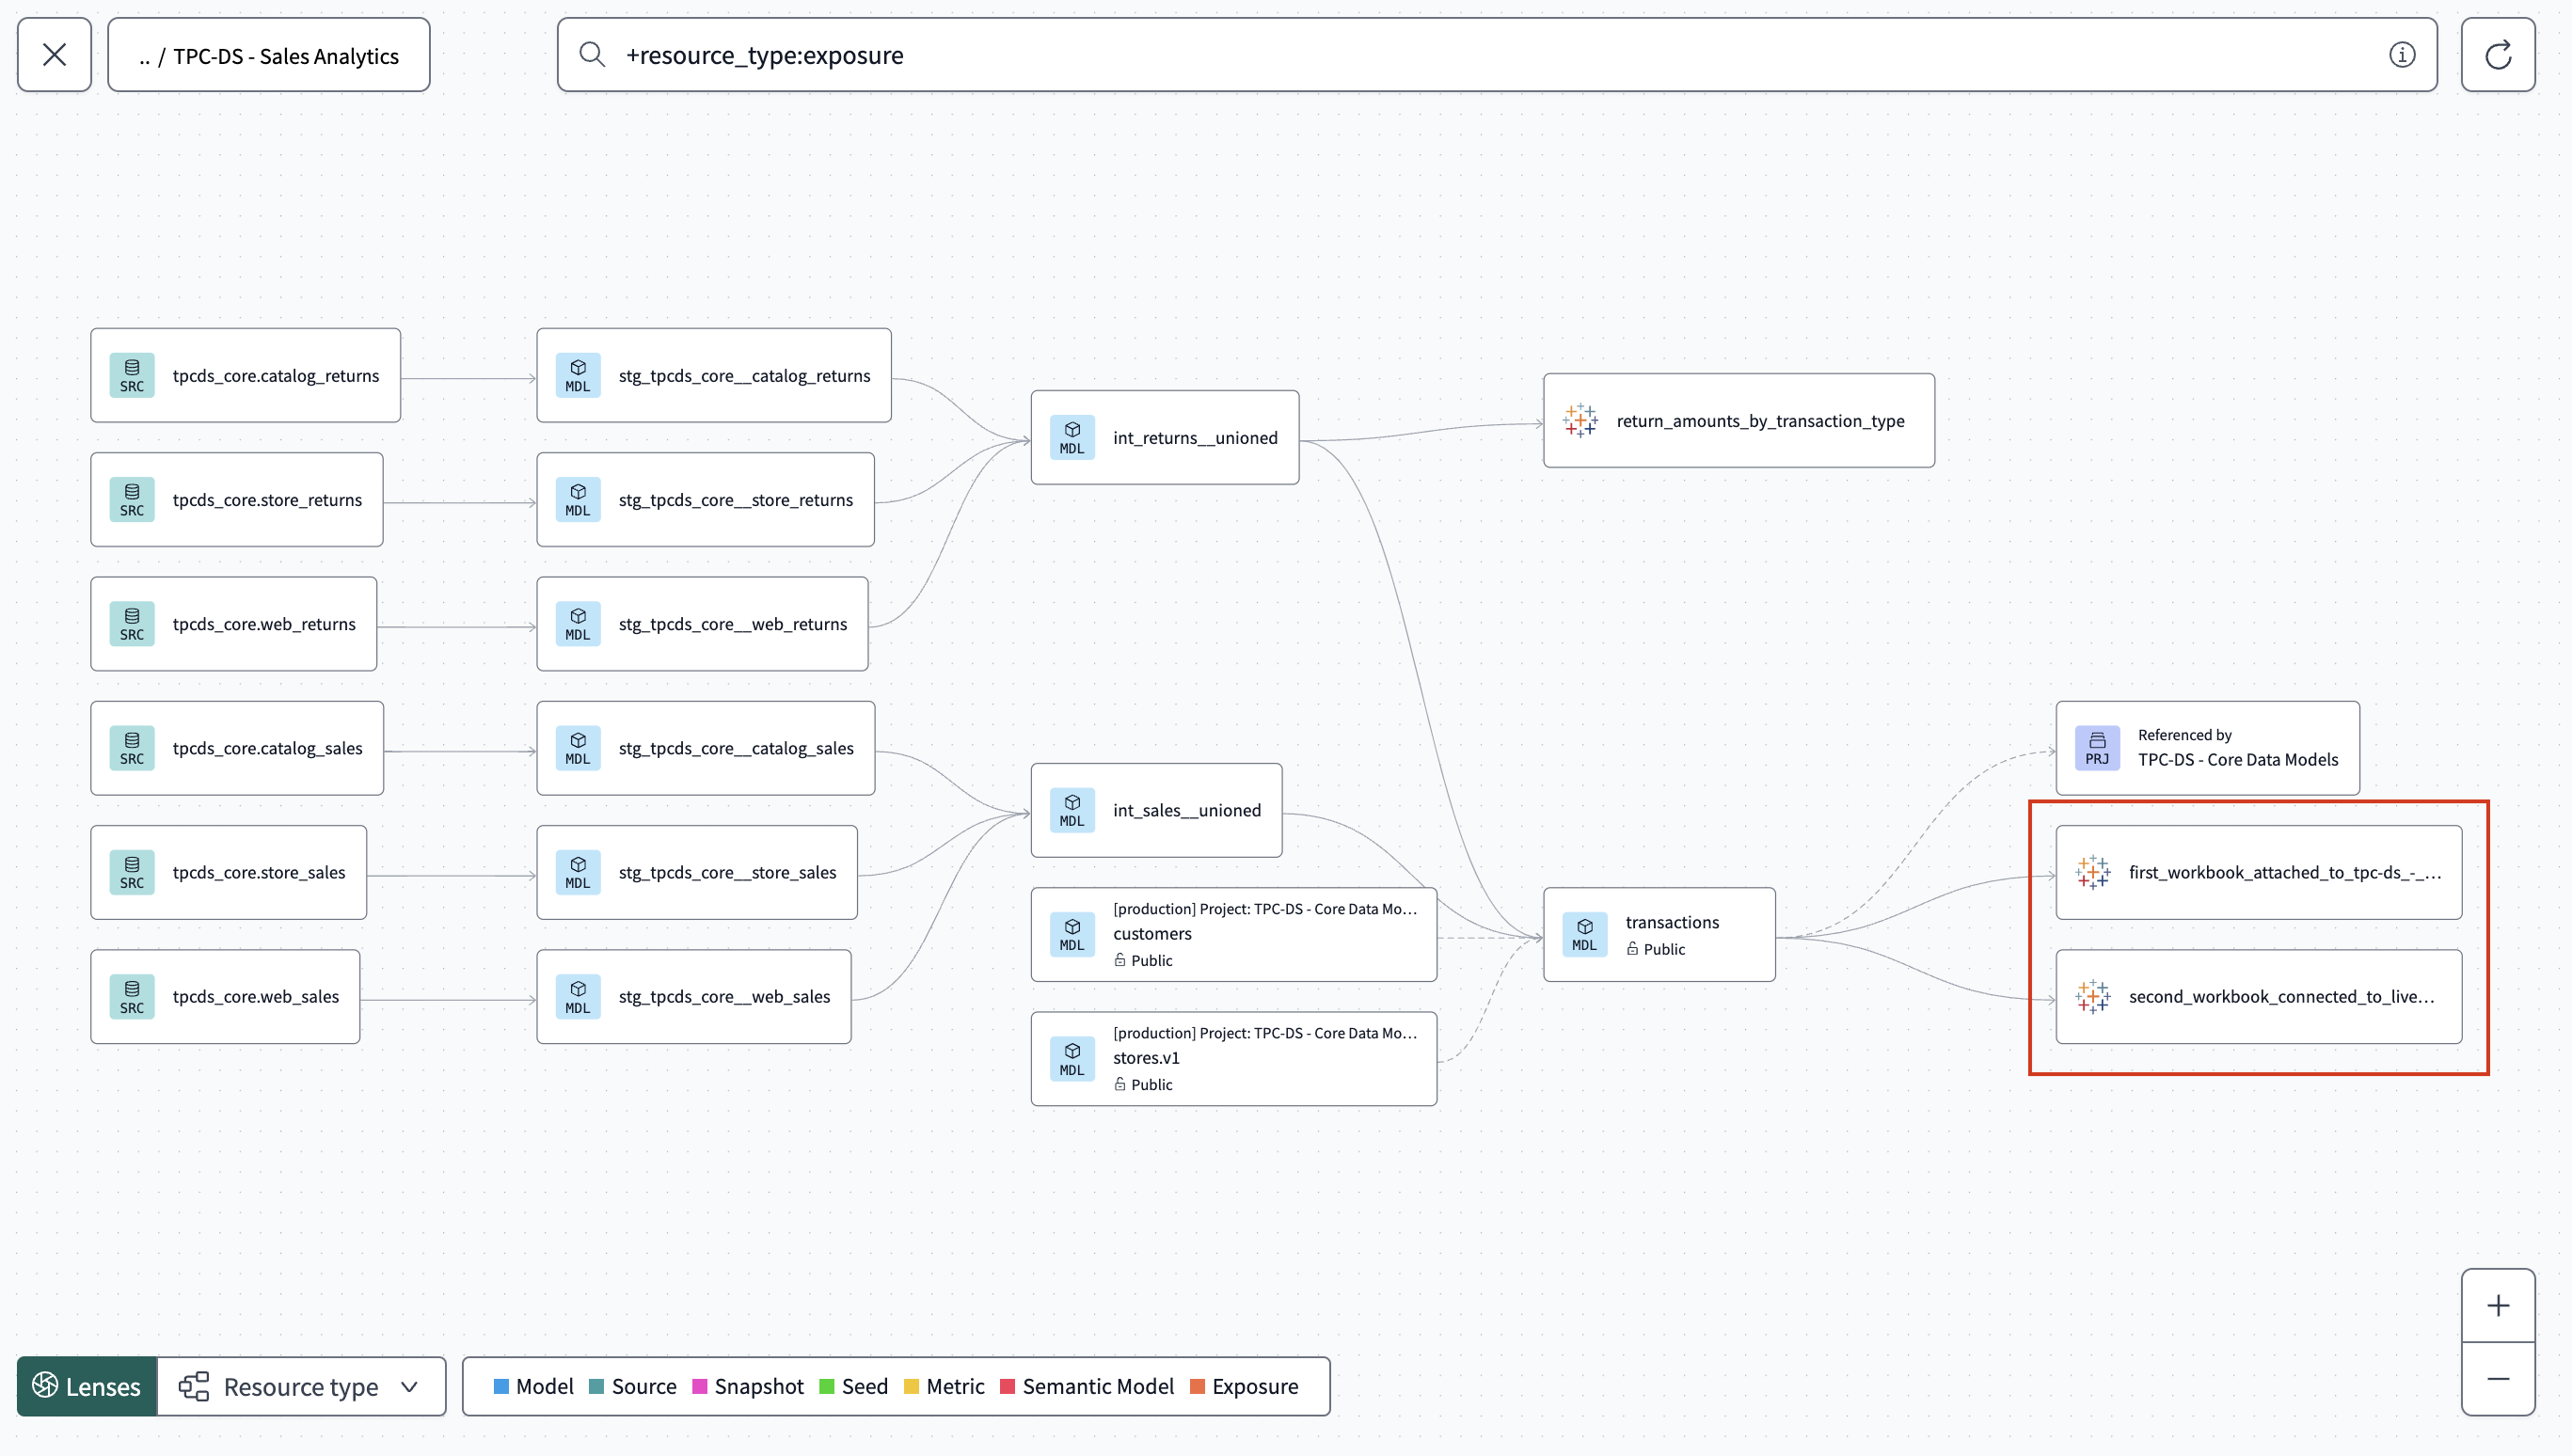
Project lineage
From the Project lineage view, which visualizes the dependencies and relationships in your project. Exposures are represented with the Tableau icon, offering an intuitive way to see how they fit into your project's overall data flow.
Considerations
Auto-exposures with Tableau have the following considerations:
-
You can only connect to a single Tableau site on the same server.
-
If you're using Tableau Server, you need to allowlist dbt Cloud's IP addresses for your dbt Cloud region.
-
Tableau dashboards built using custom SQL queries aren't supported.
-
Auto-exposures sync automatically once per day or when a user updates the selected collections.
